> ## Documentation Index
> Fetch the complete documentation index at: https://docs.consensus.app/llms.txt
> Use this file to discover all available pages before exploring further.
# Find the seminal papers in a field
> New to a field? Surface the foundational papers, deep-read the most cited one, and map its citation graph in three searches.
Entering a new field without a mentor, it's hard to know which papers everyone considers foundational. This tutorial uses the financial instability hypothesis in behavioral economics as the example.
**You'll learn how to:**
1. Identify landmark papers in any discipline
2. Get a deep walkthrough of a foundational paper's core contribution
3. Visualize a citation graph to see a paper's place in the field
## Step 1: Ask for the seminal work
```text theme={null}
Find the top papers on the financial instability hypothesis and explain why
they're considered seminal.
```
Research Agent identifies the key author behind the theory, runs an author search for their work, and runs a broader search for other highly referenced papers. It reads the full text and abstracts of the strongest candidates and returns a table of key works, their core contributions, and why each counts as seminal.
## Step 2: Deep-read the most cited paper
```text theme={null}
Pull up the most cited paper in this set and walk me through its core
contributions.
```
Consensus uses the context from the first search, identifies the most cited paper (the original Minsky paper), reads its full text, and summarizes the core theoretical insights. Ask follow-ups for deeper analysis.
## Step 3: Open the citation graph
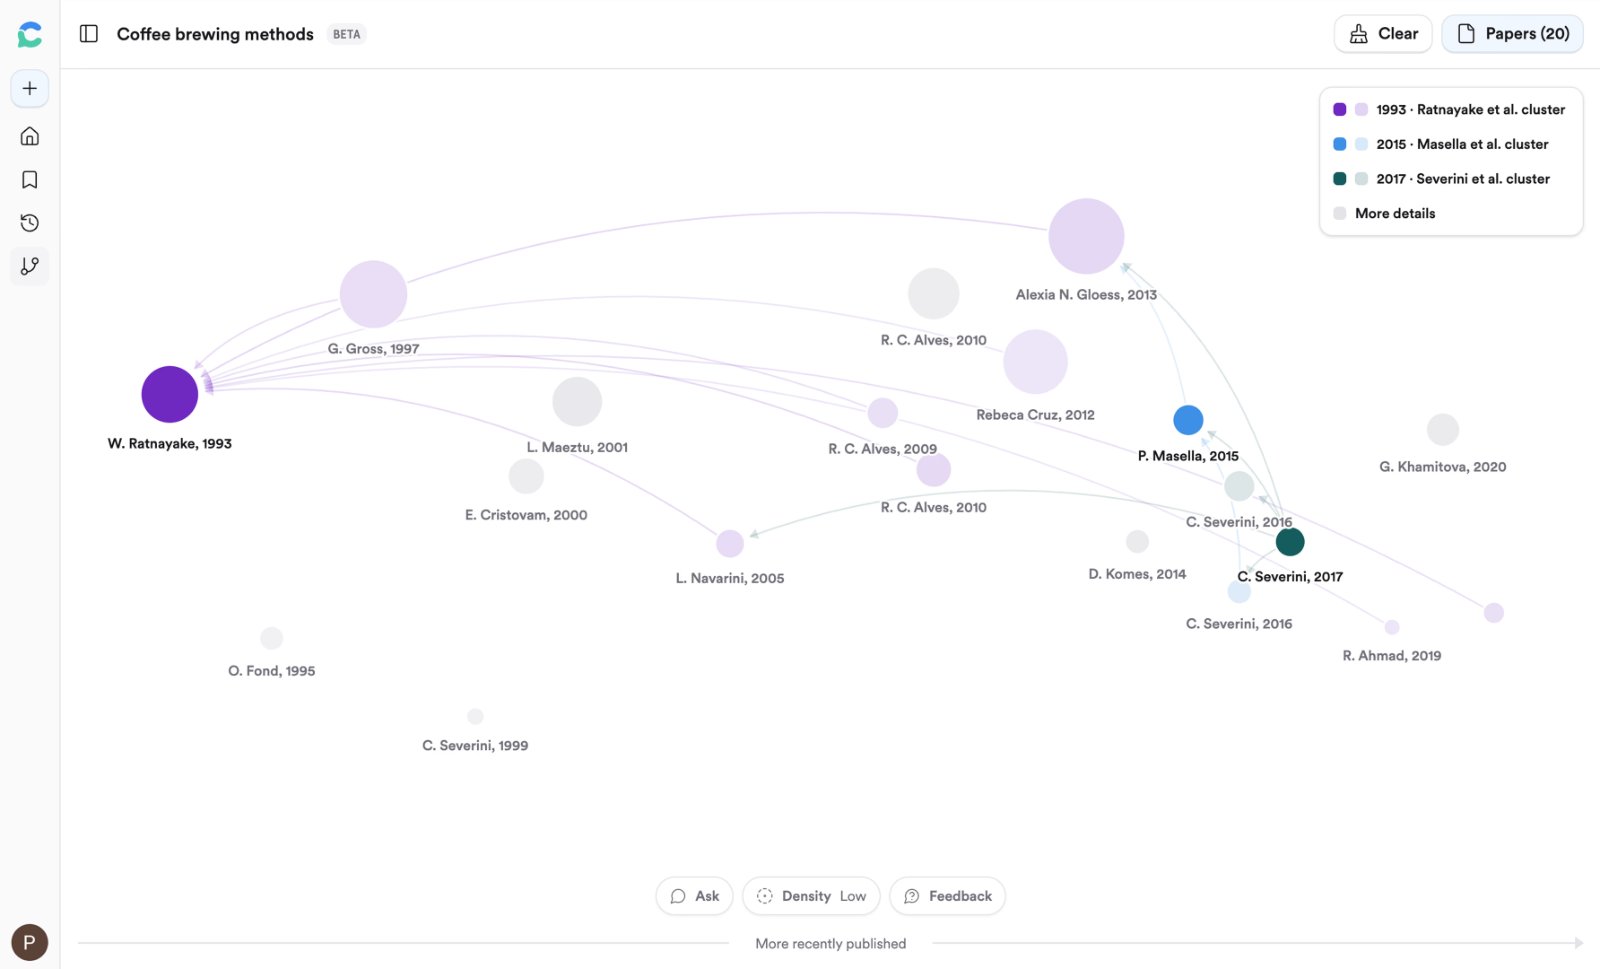
Hover over the paper, open it, and click **Graph**. Consensus generates a citation graph of highly related papers that either cite this paper or are cited by it, both forward and backward in time. Hover any node to see its connections.
From here you can ask for a research timeline, a research gaps analysis, or similar papers from the last few years. See [Citation Graph](/core-features/citation-graph).
## Reading what Research Agent did
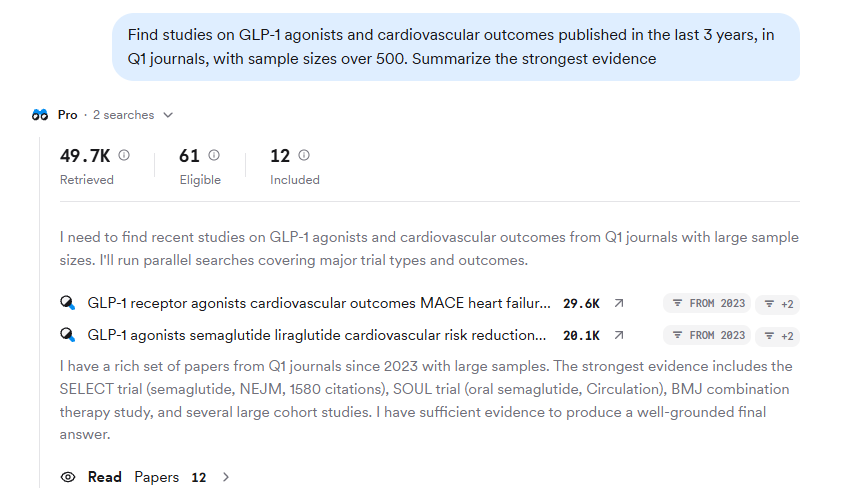
Every Pro answer opens with a trace of the agent's work: how many papers it retrieved, how many were eligible, how many it included, and the sub-searches it ran with their filters. Expand it to check that the plan matched your intent before you trust the summary.
## Reading the citation graph
| Element | Meaning |
| --------------- | ------------------------------------------- |
| Horizontal axis | Time, older on the left |
| Node size | Citation count |
| Color | Seed clusters; gray nodes are bridge papers |
| Opacity | How well connected the paper is |
| Arrows | Point from a paper to the paper it cites |
Use **+ Seed** to promote a result and regenerate, the minus button to exclude one, and **Density** to show 20, 40, or 60 papers. See [Citation Graph](/core-features/citation-graph) for how ranking works.
## Related tutorials
 ## Reading the citation graph
 | Element | Meaning |
| --------------- | ------------------------------------------- |
| Horizontal axis | Time, older on the left |
| Node size | Citation count |
| Color | Seed clusters; gray nodes are bridge papers |
| Opacity | How well connected the paper is |
| Arrows | Point from a paper to the paper it cites |
Use **+ Seed** to promote a result and regenerate, the minus button to exclude one, and **Density** to show 20, 40, or 60 papers. See [Citation Graph](/core-features/citation-graph) for how ranking works.
## Related tutorials
| Element | Meaning |
| --------------- | ------------------------------------------- |
| Horizontal axis | Time, older on the left |
| Node size | Citation count |
| Color | Seed clusters; gray nodes are bridge papers |
| Opacity | How well connected the paper is |
| Arrows | Point from a paper to the paper it cites |
Use **+ Seed** to promote a result and regenerate, the minus button to exclude one, and **Density** to show 20, 40, or 60 papers. See [Citation Graph](/core-features/citation-graph) for how ranking works.
## Related tutorials