
How to build a graph
1
Open the graph
Click Graph in the left sidebar, or click Citation Graph on any paper’s sidebar to seed the graph with that paper.
2
Add seeds
Add up to 5 seed papers from your recently saved papers or by searching from the Graph page. One seed traces the lineage of an idea in both directions; several seeds find the overlap between literatures.
3
Choose density
Show 20, 40, or 60 papers.
4
Explore
Hover a paper to see its citation connections. Click into a paper for details. Promote a result to a seed to regenerate the graph around it, or Exclude papers you don’t want.
5
Chat with the graph
Click Chat at the bottom of the page. All seeds and results are attached as context, so you can ask how papers connect, how the research built on earlier work, or what patterns emerge.
How papers are ranked
Citation Graph doesn’t use keyword matching. It combines three citation signals:- Direct citations — the paper cites your seed, or your seed cites it.
- Co-citation — how often the paper and your seed appear together in other papers’ reference lists.
- Bibliographic coupling — how many references the paper shares with your seeds.
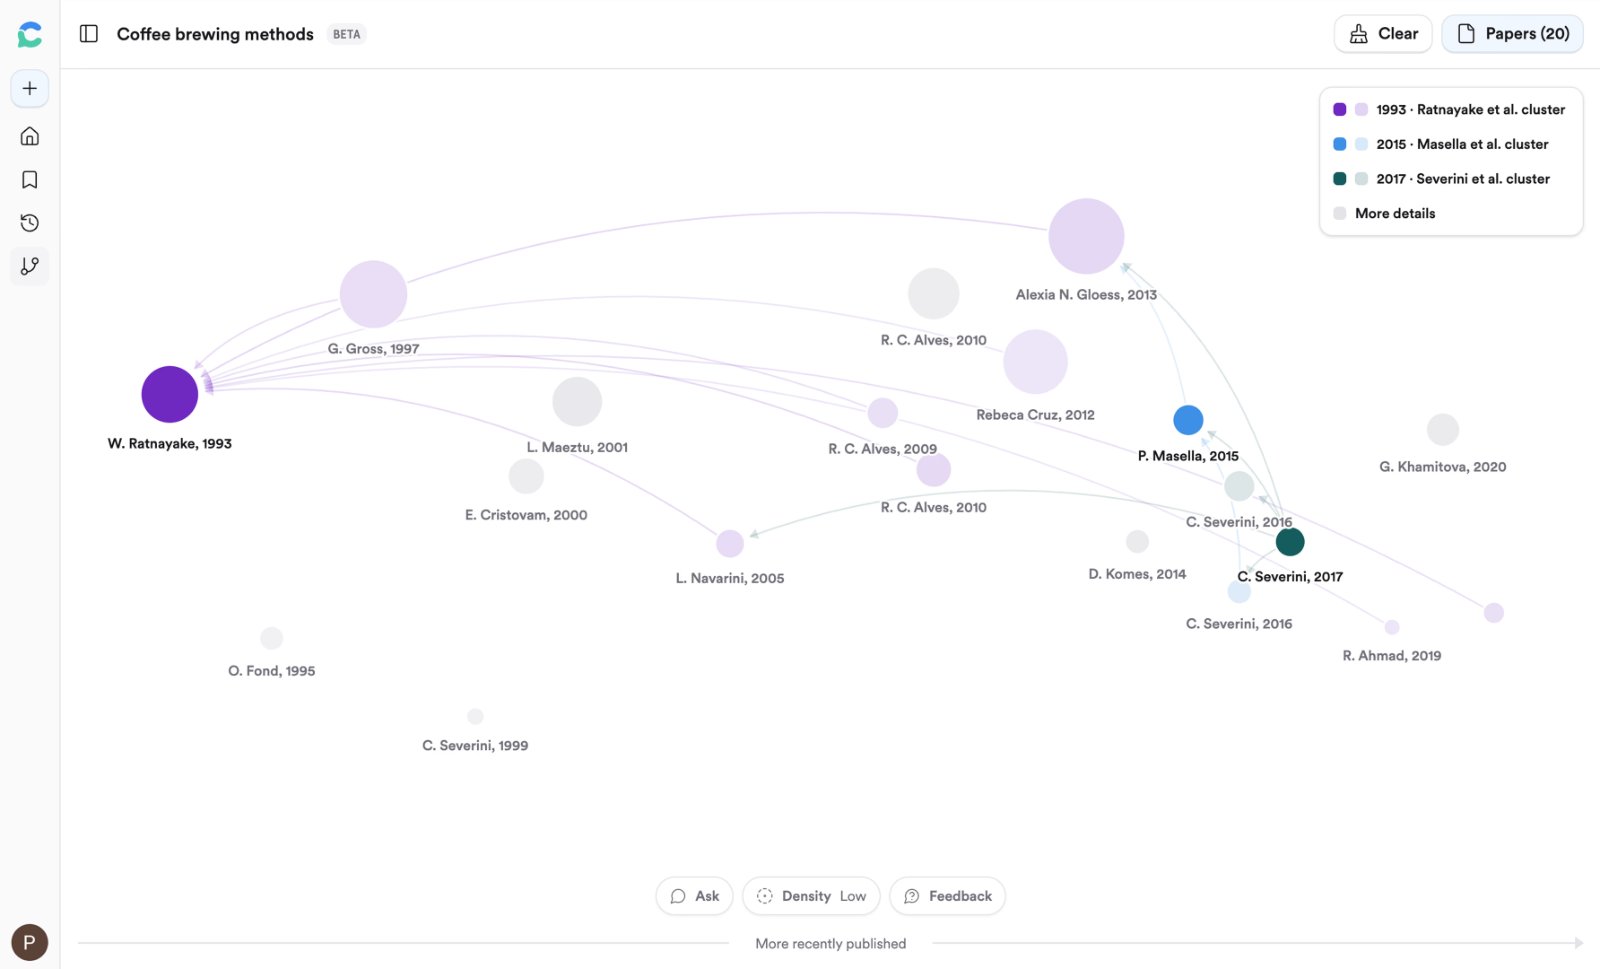
Three seeds and their clusters. Older papers sit left, newer right; node size is citation count.
Reading the graph
A legend sits in the top-right corner. You can also sort and filter by citation count, journal rank (SJR), study design, and sample size.
Questions to ask the graph
Citation Graph is in beta. Graphs aren’t saved yet; closing or refreshing the page clears the graph.
Related
Research Agent
Ask for citation chaining in plain language.
Library
Save graph results into a Collection.