
Sometimes you need to understand one person’s footprint: what they’ve published, and what influence it’s had. Instead of scouring ResearchGate or Google Scholar, ask Consensus. The example uses a PhD candidate with a handful of papers, not a famous name, to show it works for early-career researchers too.
You’ll learn how to:
- Run an author-scoped search filtered by topic
- Rank a researcher’s papers by citation impact
- Visualize the citation graph and regenerate it with several seeds
Step 1: Find the author’s papers on a topic
Step 2: Trace the paper’s impact
Step 3: Triangulate with the citation graph
Scroll up to the original thread, click the paper, and click Graph. A new tab opens with the 15 papers most related to it, forward and backward. Open the sidebar, add two or three more papers as seeds, and click Regenerate graph. The graph now shows papers related to all of the seeds together, which is a fast way to find work on a narrow niche.Reading and refining the graph
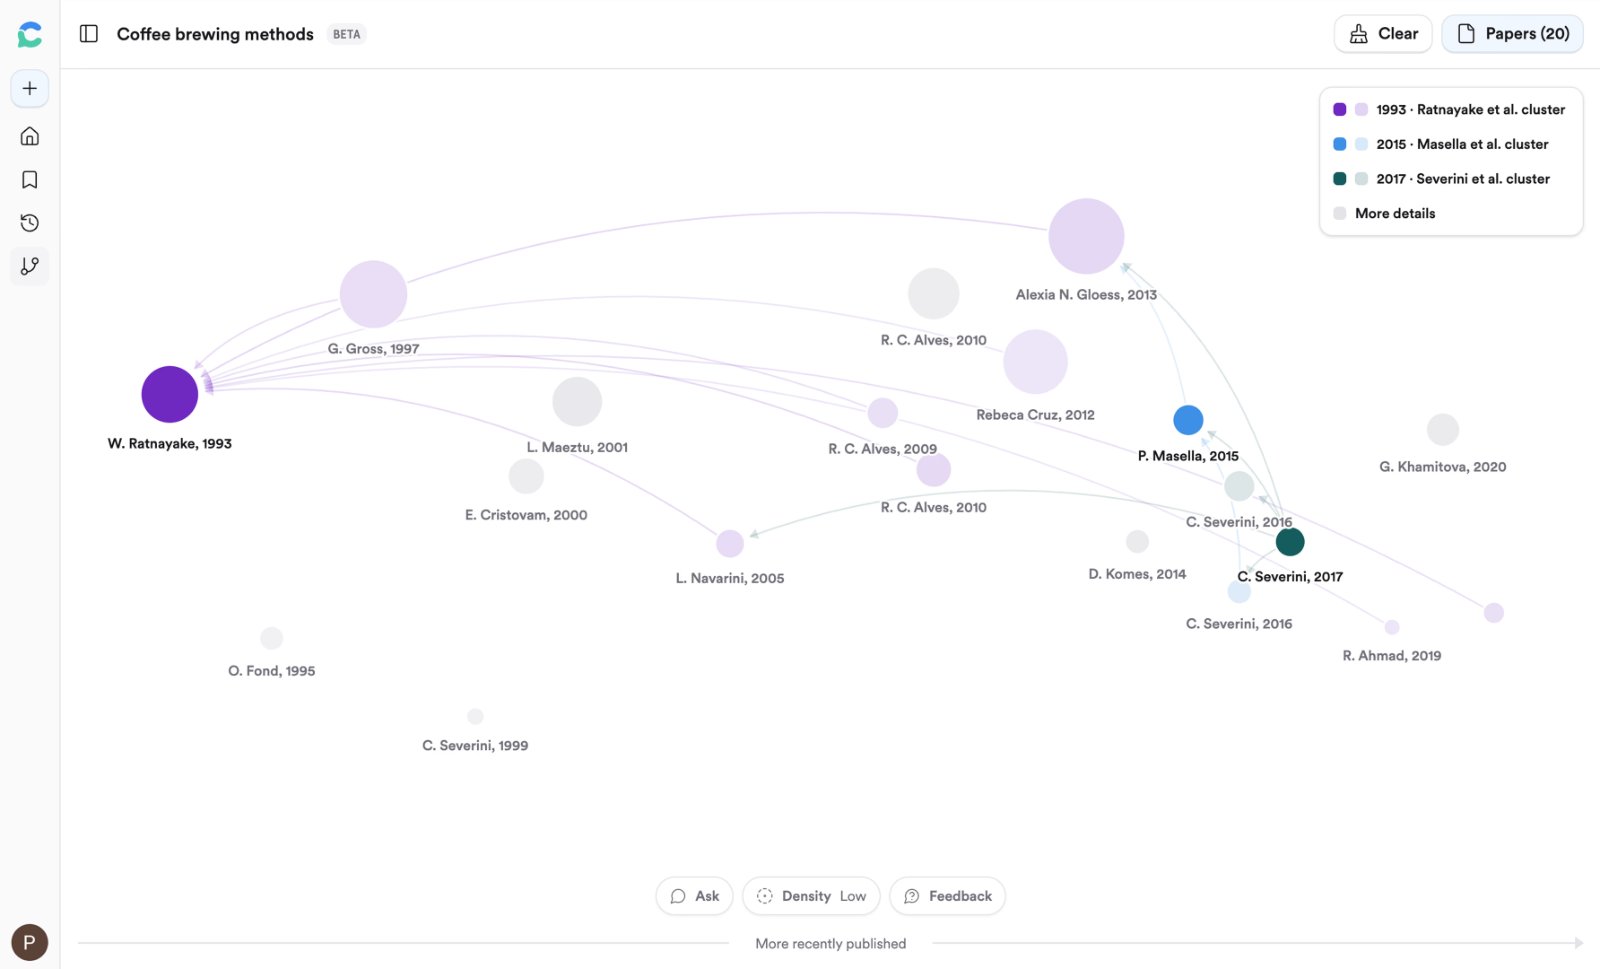
Each seed gets a color; papers one hop away take that color. Gray nodes bridge clusters.
- Horizontal axis is time; node size is citation count; opacity shows how connected a paper is.
- Arrows point from a paper to the paper it cites. Hover a node to highlight its connections.
- + Seed promotes a result to a seed; the minus button excludes it; Density switches between 20, 40, and 60 papers.
- Click Chat at the bottom to ask questions with all seeds and results attached.