
Entering a new field without a mentor, it’s hard to know which papers everyone considers foundational. This tutorial uses the financial instability hypothesis in behavioral economics as the example.
You’ll learn how to:
- Identify landmark papers in any discipline
- Get a deep walkthrough of a foundational paper’s core contribution
- Visualize a citation graph to see a paper’s place in the field
Step 1: Ask for the seminal work
Step 2: Deep-read the most cited paper
Step 3: Open the citation graph
Hover over the paper, open it, and click Graph. Consensus generates a citation graph of highly related papers that either cite this paper or are cited by it, both forward and backward in time. Hover any node to see its connections.Reading what Research Agent did
Every Pro answer opens with a trace of the agent’s work: how many papers it retrieved, how many were eligible, how many it included, and the sub-searches it ran with their filters. Expand it to check that the plan matched your intent before you trust the summary.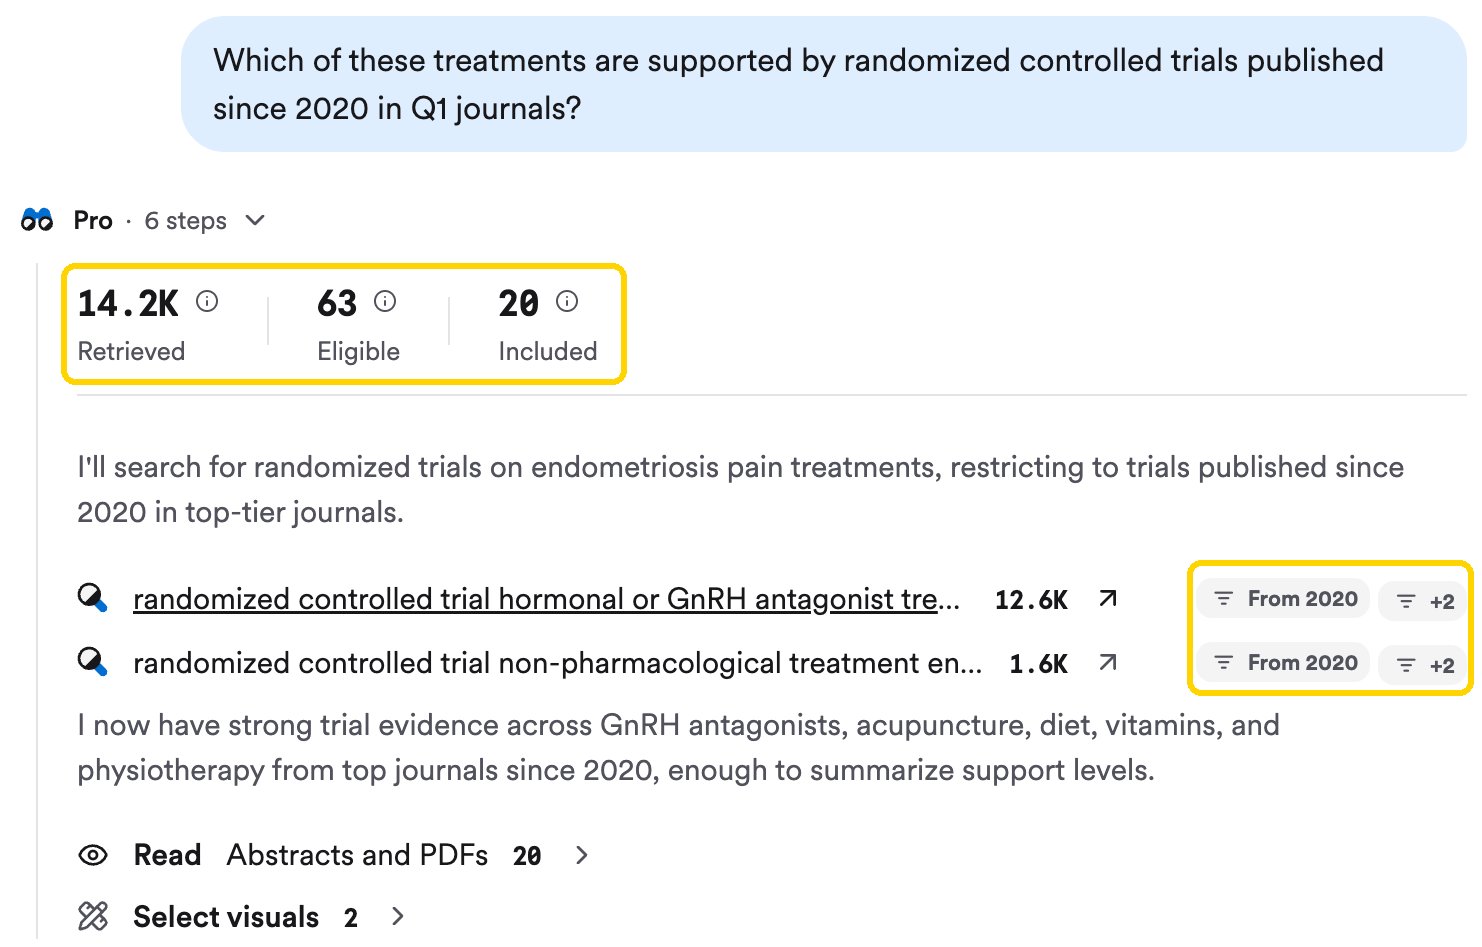
The agent's plan: two parallel searches with year and journal filters, 14.2K retrieved, 63 eligible, 20 included.
Reading the citation graph
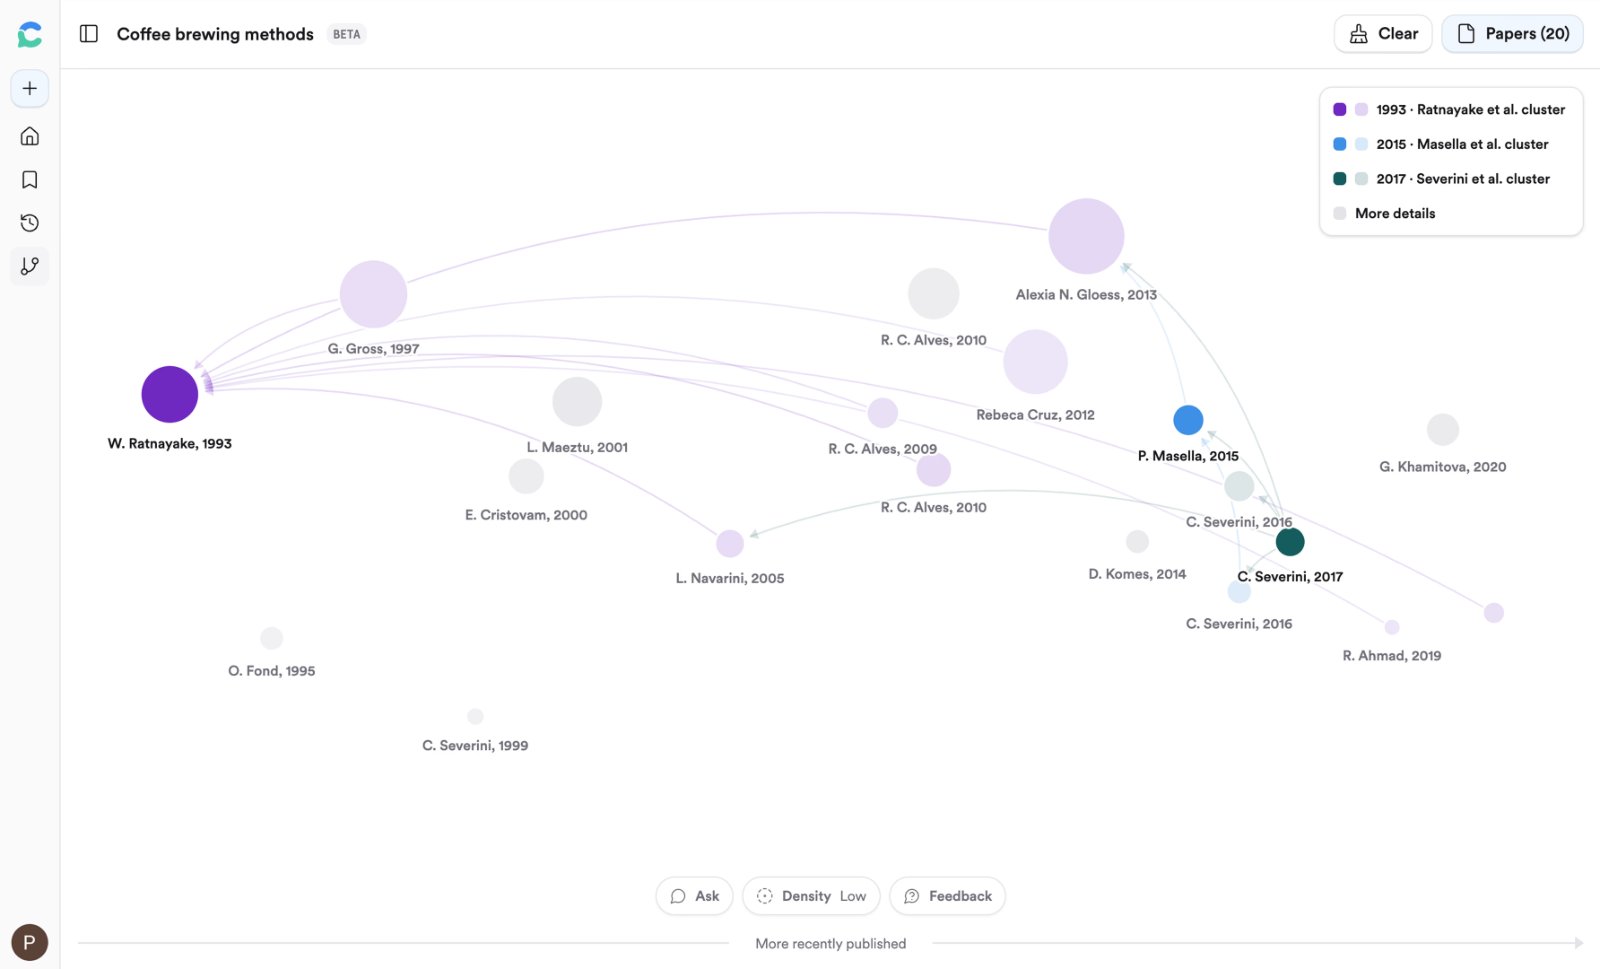
Older papers sit left, newer right; node size is citation count; color marks each seed's cluster.
Use + Seed to promote a result and regenerate, the minus button to exclude one, and Density to show 20, 40, or 60 papers. See Citation Graph for how ranking works.